API analytics
The API analysis screen displays statistics such as cache hits and execution times for each API request made on the site.
Accessing the screen
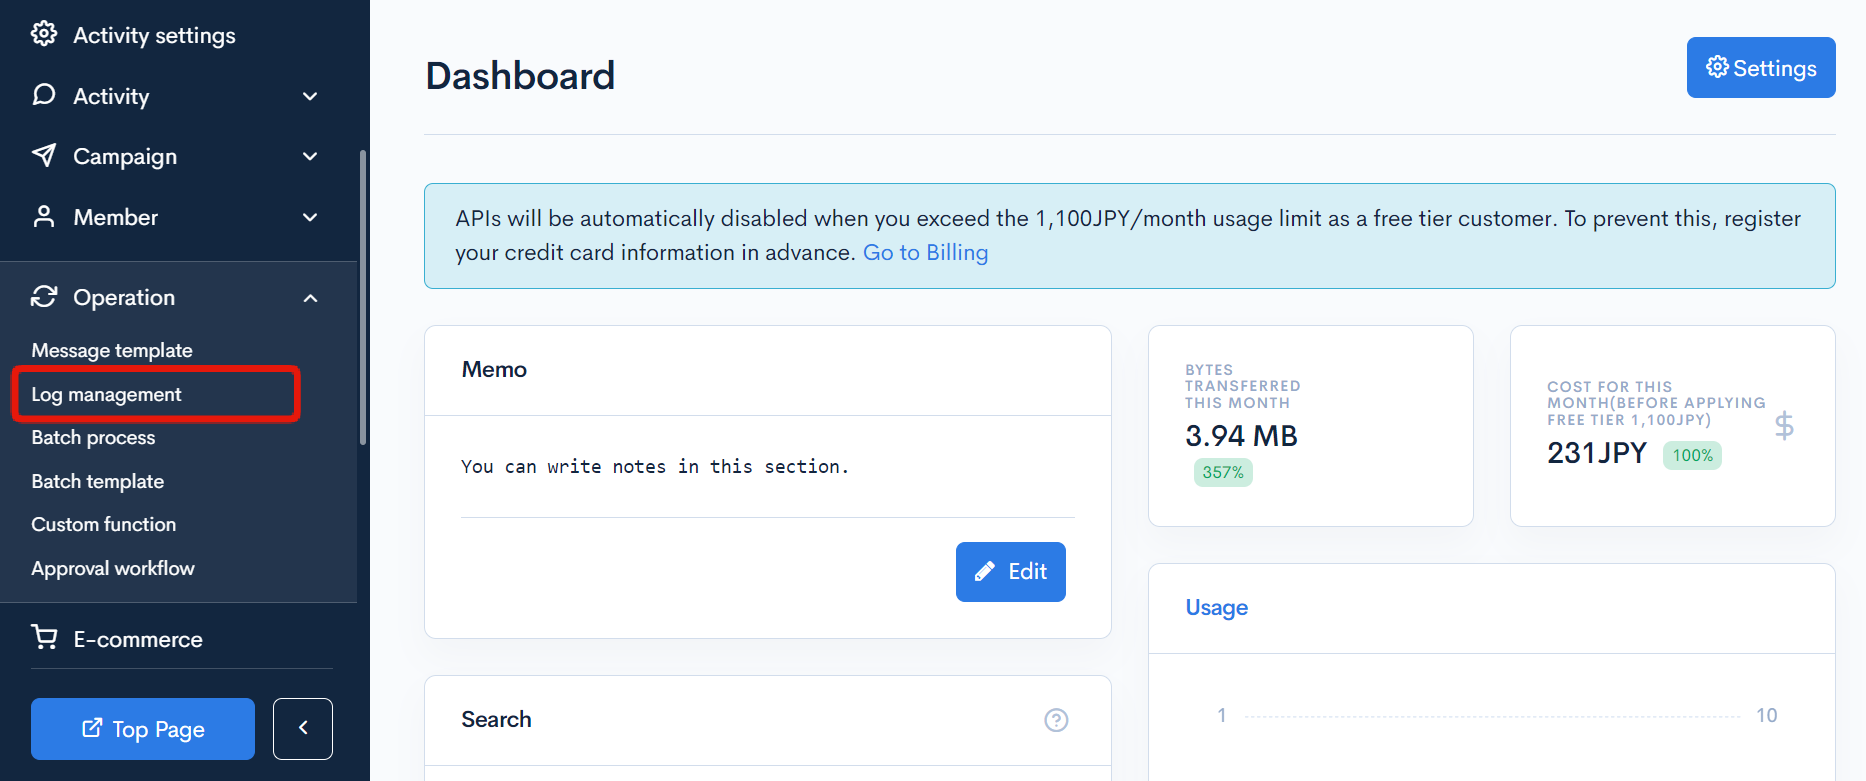
In the left sidebar menu, click [Operation] -> [Log management].

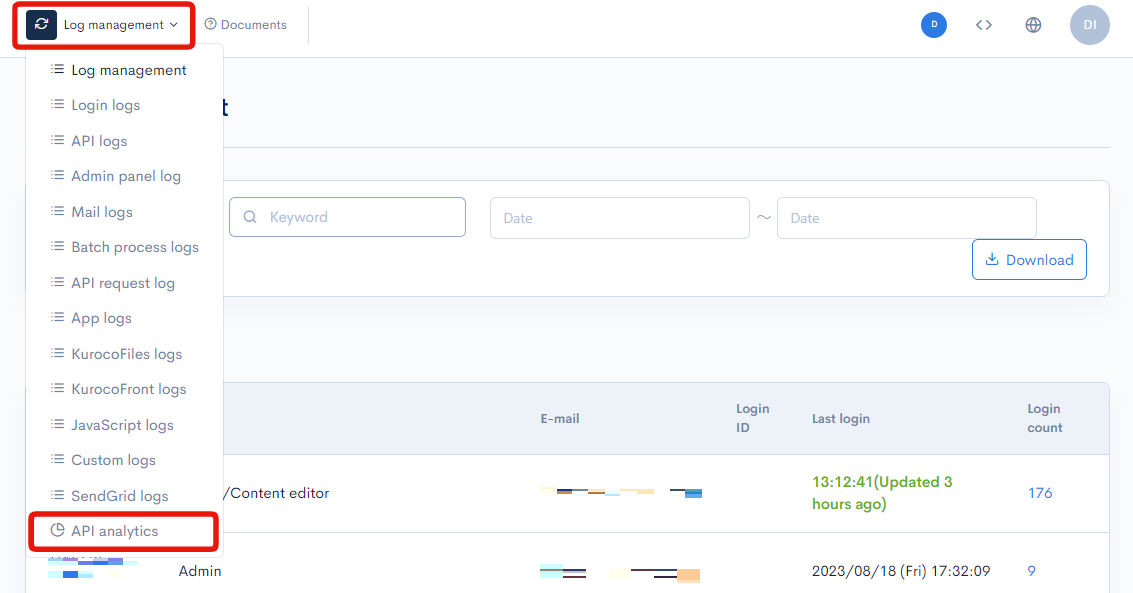
Click the [Log management] link above the page title, and select [API logs] in the dropdown menu.

Field descriptions

Filter conditions
You can filter the logs easily using the keywords search and log date/time, advanced search functions.
Keywords search

Enter the search keyword in the [Keyword] text box and click [Search] to filter logs that contain the specified keyword.
Timestamp search

Select the date and time range for the timestamp and click [Search]. The designated logging period is 35 days. When specifying past log dates, please make sure to specify within the 35-day range.
Advanced search
Click the [Advanced search] button to input advanced filter conditions.

The following input options are available:
| Field | Description | Specifiable conditions |
|---|---|---|
| URL | URL of the page accessed. | Available search operations |
| Hit | The number of hits on a request. | Available search operations |
| Execution time | Time taken by the server to process the request in seconds. | Available search operations |
| Body size | Response body size in bytes. | Available search operations |
| Cache status | Indicates if this request was served by a cache. | Cache status |
| API ID | API ID. | Available search operations |
| API URI ID | API URI ID. | Available search operations |
The advanced search function allows you to concatenate multiple conditions using AND or OR.
AND: Returns only data matching all the specified conditions in your search.OR: Returns data matching any of your specified conditions.
Available search operations
You can use the following operations in applicable search conditions:
| Operation | Input type | Returned data |
|---|---|---|
contains | Text string | Entries matching part of the search term. |
not contains | Text string | Entries not matching any part of the search term. |
= | Alphanumeric string | Entries exactly matching the search term. |
!= | Alphanumeric string | Entries not exactly matching the search term. |
< | Alphanumeric string | Entries less than the search term. |
> | Alphanumeric string | Entries greater than the search term. |
<= | Alphanumeric string | Entries less than or equal to the search term. |
>= | Alphanumeric string | Entries greater than or equal to the search term. |
starts with | Text string | Entries beginning with the search term. |
not starts with | Text string | Entries not beginning with the search term. |
ends with | Text string | Entries ending with the search term. |
not ends with | Text string | Entries not ending with the search term. |
in | Alphanumeric string | Entries matching any of the search terms (for multiple search terms only). |
not in | Alphanumeric string | Entries not matching any of the search terms (for multiple search terms only). |
*Only numerical operations are allowed for execution_time and body_size.
Sort
Under "Sort", you can specify the sort key and display order of the search results.
ASC: Ascending, from oldest to newest / smallest to largest.DESC: Descending, from newest to oldest / largest to smallest.
Sort key options:
Hitexecution_timebody_sizecache_statusapi_idapi_uri_id
Log entries
The columns displayed for the log entries are as follows:
| Column | Description |
|---|---|
| API ID | API ID. |
| HTTP method | HTTP method of the request. |
| API URI ID | API URI ID. |
| Cache status | Indicates if the request was served by a cache. See: Cache status below for details. |
| Status | HTTP response status code for the request. |
| Hit | Displays the number of hits on a request. |
| Execution time | Time taken by the server to process the request in seconds. |
| Body size | Response body size in bytes. |
Cache status
The cache status can take one of the values below:
| Value | Description |
|---|---|
| HIT | Request was made by a cache. |
| MISS | Request reached the server and no cache was found. |
| PASS | Request could not be cached. |
| ERROR | An error occurred during caching. |
Buttons

| Button | Description |
|---|---|
| Search | Search based on the above settings. |
| Download | Download a list of the displayed logs. |
| Delete | Delete a list of the displayed logs. |
Log list download
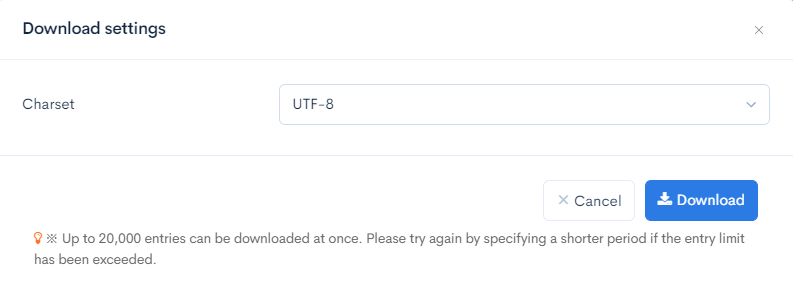
After click [Download] button, the download settings will open.


| Field(s) | Description |
|---|---|
| Charset | Character encoding of the output CSV file. |
| Cancel | Cancel downloading. |
| Download | Execute downloading. |
Support
If you have any other questions, please contact us or check out Our Slack Community.